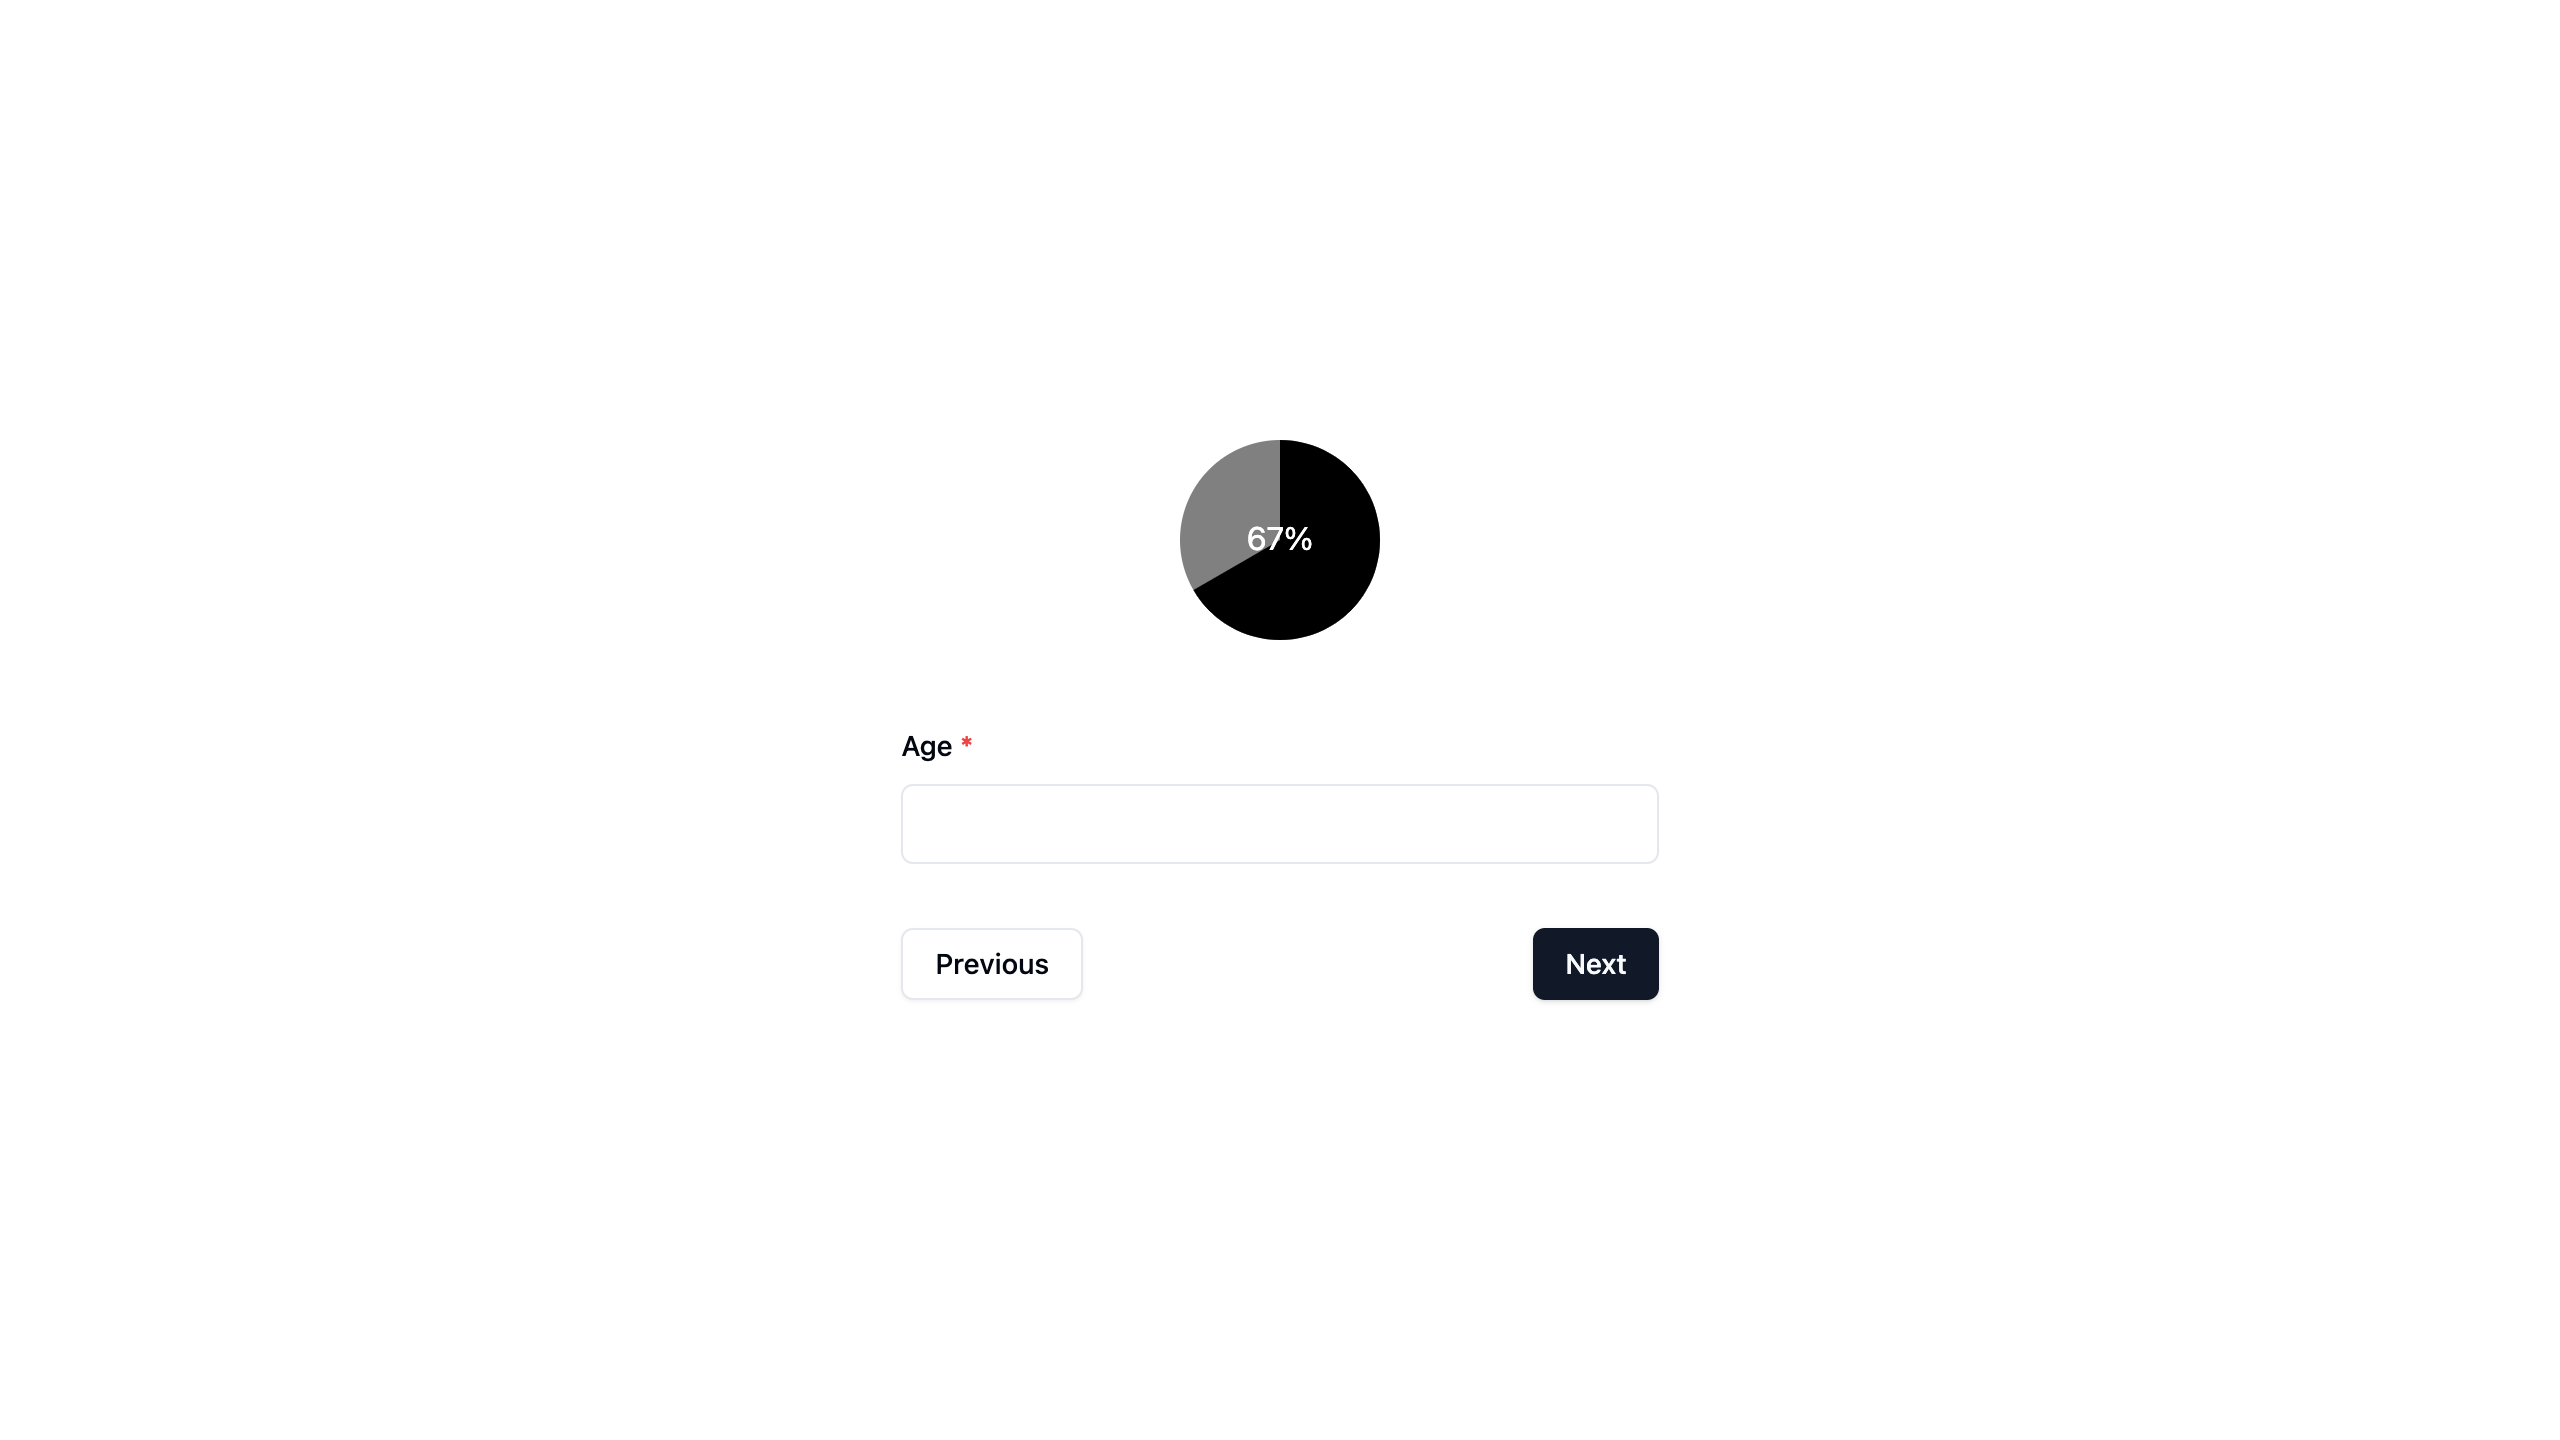
Custom Progress Indicator
If you want to provide a progress indicator of your own, Wizard of Zod allows you to do that with ease.
Code
vue
<script setup lang='ts'>
import { z } from 'zod'
import Wizard, { type Form } from 'wizard-of-zod'
import ProgressPie from '@/components/progress/ProgressPie.vue'

const forms: Form<z.ZodObject<any>>[] = [
  {
    schema: z.object({
      givenName: z.string().min(2),
      familyName: z.string()
    })
  },
  {
    schema: z.object({
      gender: z.enum(['male', 'female'])
    })
  },
  {
    schema: z.object({
      age: z.number()
    })
  },
]

const handleCompleted = (data: Record<string, any>) => {
  console.log(data)
}
</script>

<template>
  <div class="h-screen flex justify-center items-center">
    <Wizard
      :classes="{
        woz: 'w-1/3',
        wozBody: 'flex-col-reverse',
        wozForm: 'space-y-8',
      }"
      :forms="forms"
      progress-indicator="bar"
      @completed="handleCompleted"
    >
      <template #progressIndicator="{ currentQuestion, totalQuestions, completed }">
        <ProgressPie
          :total-forms="totalQuestions"
          :current-form-index="currentQuestion"
          :completed="completed"
        />
      </template>
    </Wizard>
  </div>
</template>
vue
<script lang="ts" setup>
import { computed, ref, watch } from 'vue'

type Props = {
  totalForms: number
  currentFormIndex: number
  completed: boolean
}

const props = defineProps<Props>()
const piePath = ref('') // Reactive path for the pie chart

// Calculate progress percentage
const progressPercentage = computed(() => {
  if (props.completed) return 100
  const index = Math.max(props.currentFormIndex - 1, 0)
  return (index / props.totalForms) * 100
})

// Generate SVG path for the pie chart based on progress
const calculatePiePath = (percentage: number): string => {
  if (percentage === 100) {
    return `M50,50 m-50,0 a50,50 0 1,1 100,0 a50,50 0 1,1 -100,0 Z`
  }

  const angle = (percentage / 100) * 360
  const largeArcFlag = angle > 180 ? 1 : 0

  const x = 50 + 50 * Math.cos((angle - 90) * (Math.PI / 180))
  const y = 50 + 50 * Math.sin((angle - 90) * (Math.PI / 180))

  return `M50,50 L50,0 A50,50 0 ${largeArcFlag},1 ${x},${y} Z`
}

// Watch progressPercentage to update the piePath with smooth transition
watch(progressPercentage, (newPercentage) => {
  const newPath = calculatePiePath(newPercentage)
  const oldPath = piePath.value

  // Animate transition between paths
  const duration = 500 // Animation duration in ms
  const start = performance.now()

  const animate = (currentTime: number) => {
    const elapsedTime = currentTime - start
    const progress = Math.min(elapsedTime / duration, 1)

    // Interpolate paths (using linear interpolation for simplicity)
    const interpolatedPath = progress < 1 ? oldPath : newPath
    piePath.value = interpolatedPath

    if (progress < 1) {
      requestAnimationFrame(animate)
    }
  }

  requestAnimationFrame(animate)
})

// Initialize piePath with the initial percentage
piePath.value = calculatePiePath(progressPercentage.value)
</script>

<template>
  <div class="flex items-center justify-center">
    <svg :width="100" :height="100" viewBox="0 0 100 100">
      <!-- Background Circle -->
      <circle cx="50" cy="50" r="50" fill="gray" />

      <!-- Foreground Path for Progress -->
      <path :d="piePath" fill="black" />

      <!-- Progress Percentage Text -->
      <text
        x="50"
        y="55"
        text-anchor="middle"
        font-size="16"
        fill="white"
      >
        {{ Math.round(progressPercentage) }}%
      </text>
    </svg>
  </div>
</template>
INFO
The wrapping <div> and classes prop are just used here for presentation purposes. You should omit them or use your own values.
Screenshot

Resulting Data
javascript
{
  givenName: 'John',
  familyName: 'Doe',
  gender: 'male',
  age: 44
}